Port Development Strategies: Learning from the Ports of Cincinnati and Northern Kentucky
Introduction
By: Aaron Jermier, Ernie Perry, Ben Zietlow, Teresa Adams
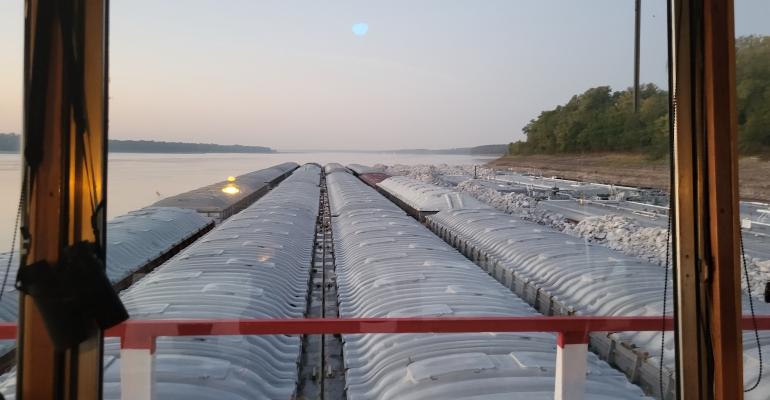
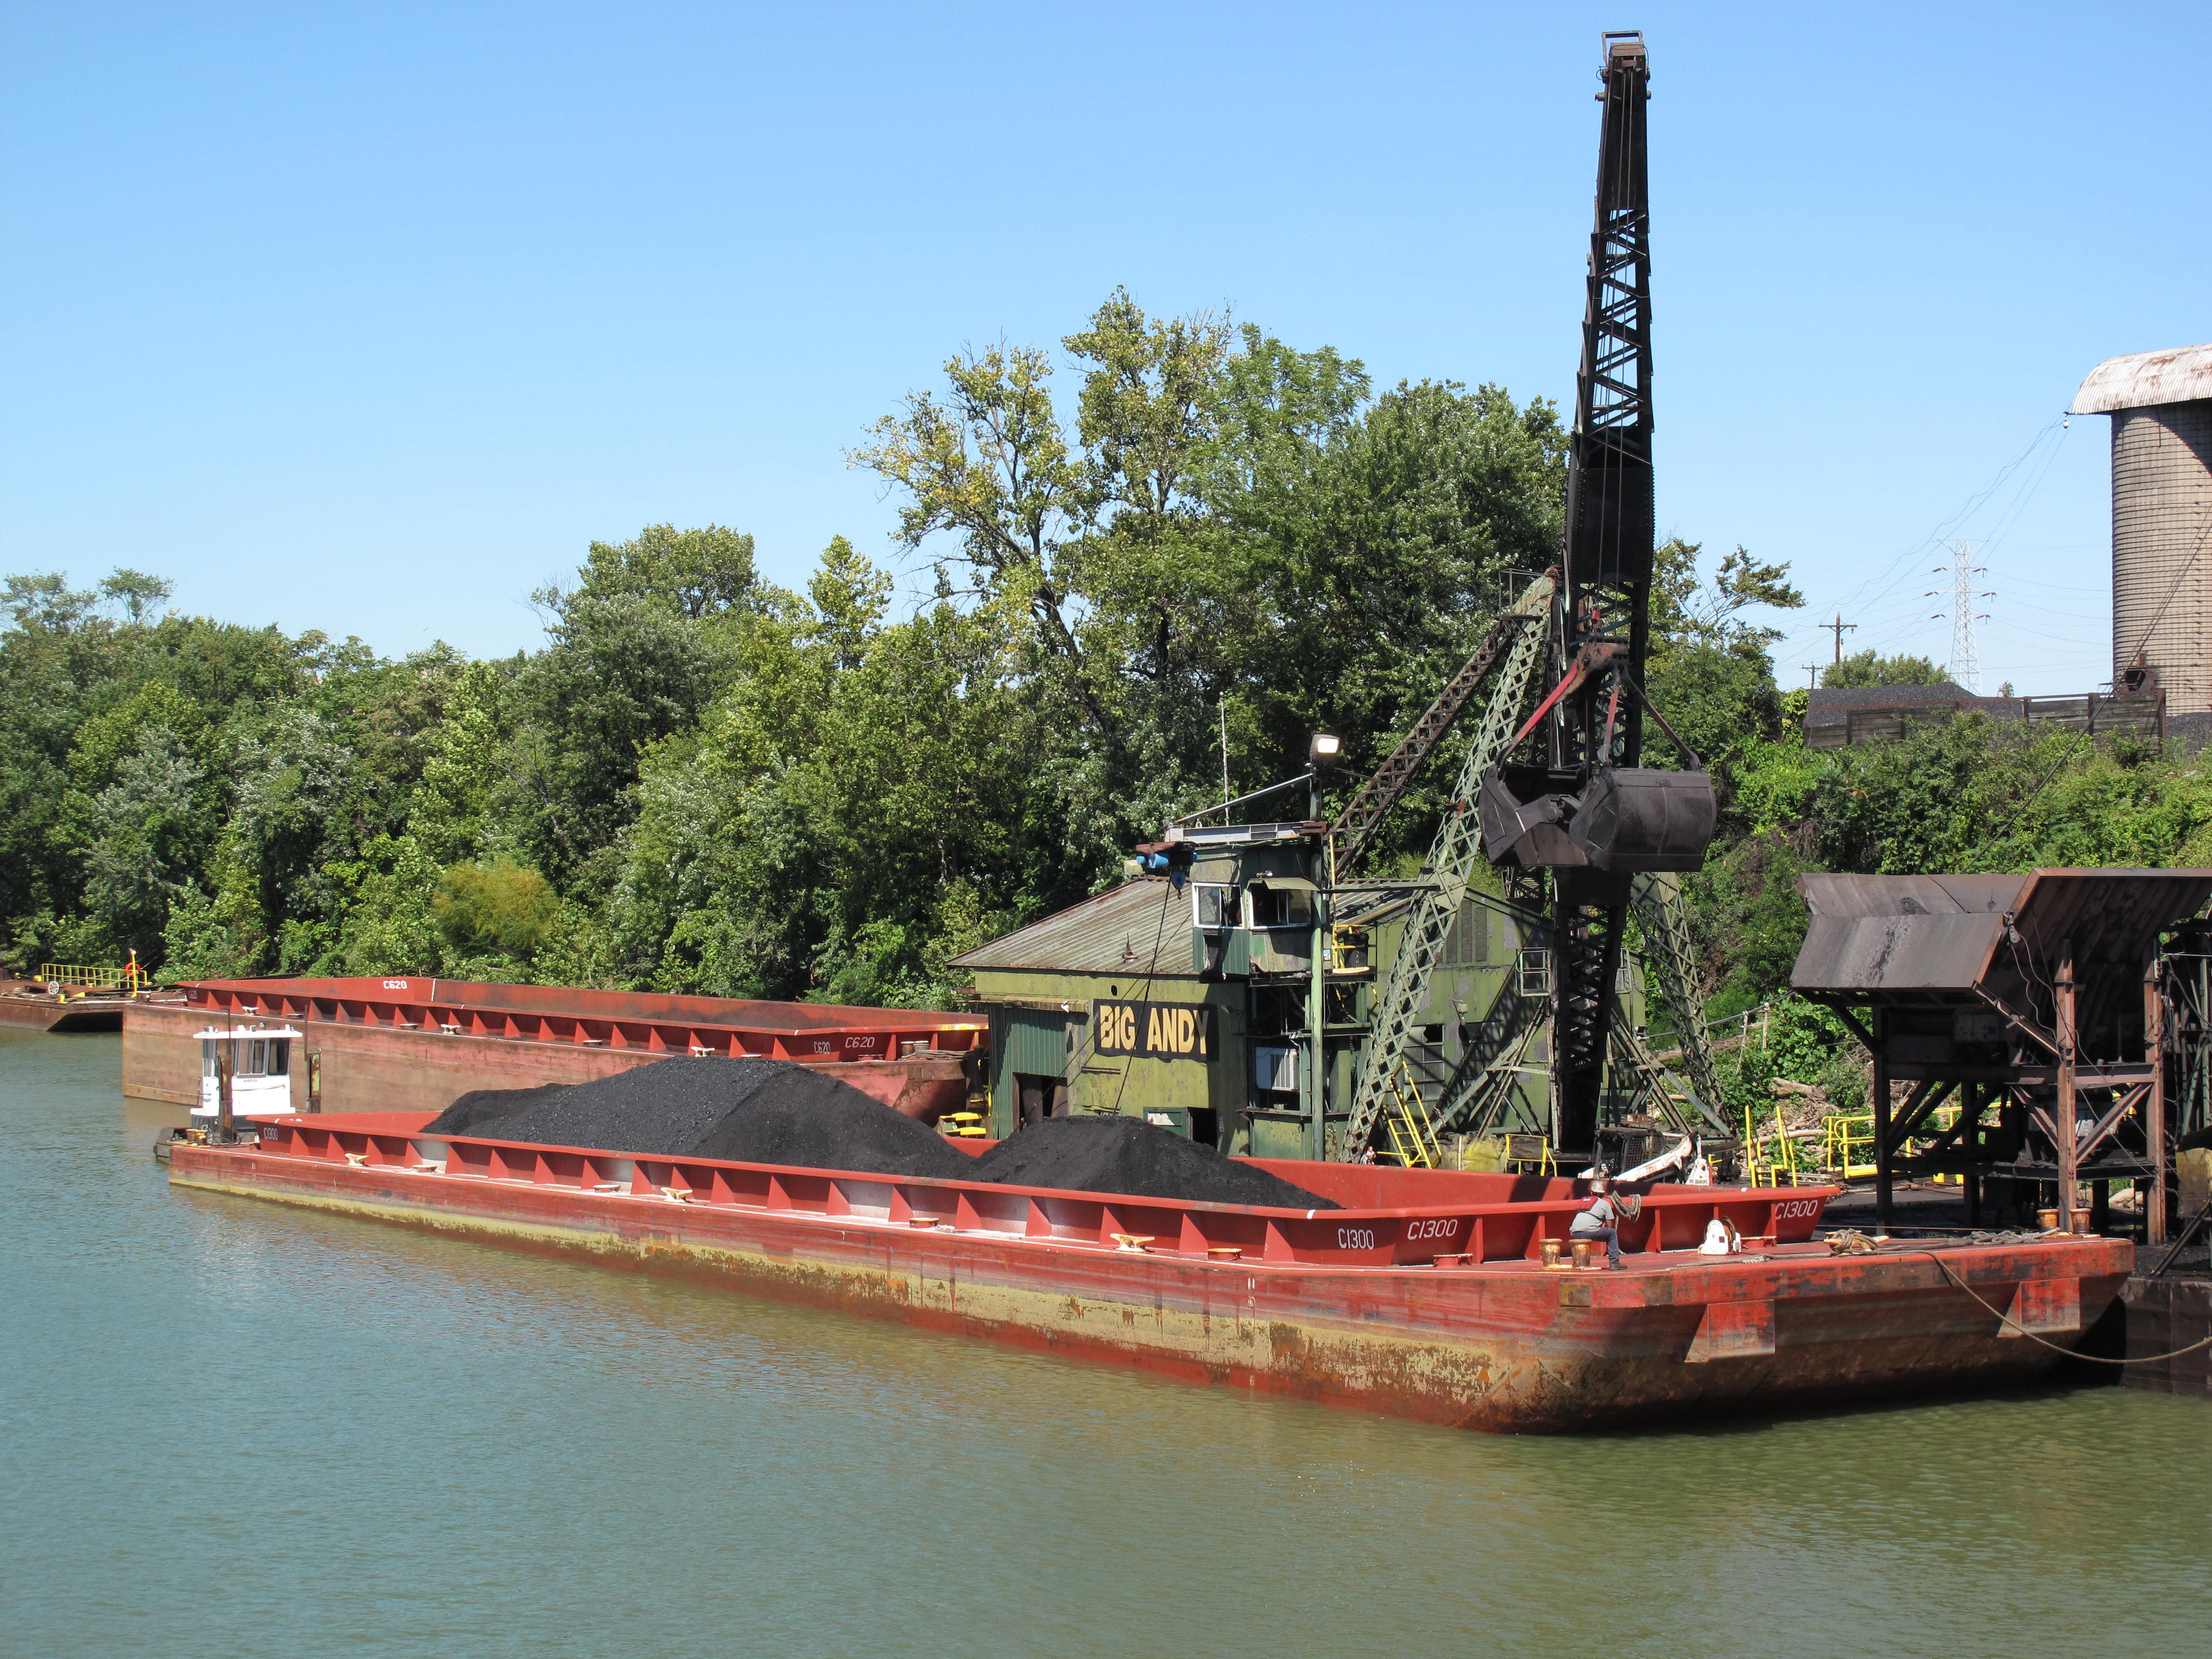
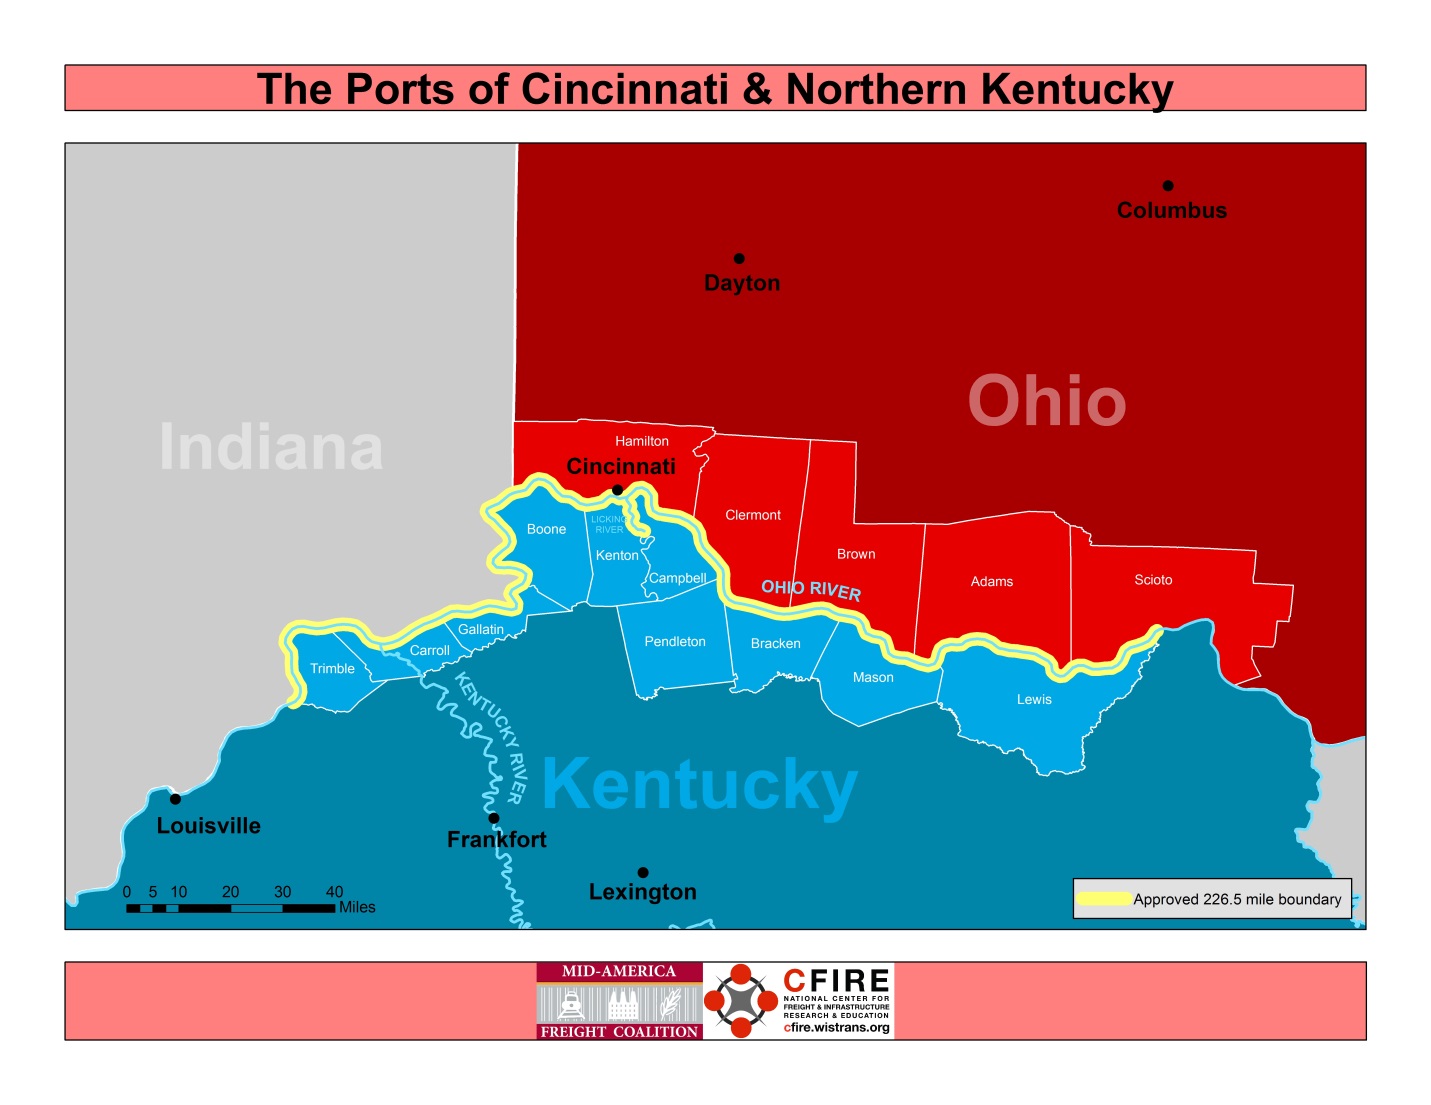
The MAFC region contains 5,610 miles (22.2% of U.S. total) of navigable inland waterways and is the largest user of the Great Lakes to move freight. Every MAFC state has direct water access to world markets via the Great Lakes and St. Lawrence Seaway and the Mississippi River. The Illinois, Ohio, and Missouri Rivers are critical for bulk transportation of coal, grain, and other products that are essential to the food processing and manufacturing economies of the Midwest. These water highways are a strategic transportation advantage for the region. As the nation’s highways and railways become more congested with freight, attention to our freight waterways and marine infrastructure continues to elevate. One port development strategy that states can use to increase awareness and leverage cooperation among regional port facilities and stakeholders is exemplified by the collaborative efforts between parties in the states of Ohio and Kentucky. As we saw in our September 2015 MAFC meeting in Cincinnati, the ports and local groups have worked with the United States Army Corp of Engineers (USACE) to re-designate the previous 26 mile port boundary to over 226 miles of river that includes more than 70 active terminals.
(http://www.cincinnatiport.org/transportation-logistics/ports-cincinnati-northern-kentucky/)
The Ports of Cincinnati and Northern Kentucky
The 2015 re-designation of the statistical port area for greater Cincinnati spans a total of 226.5 miles including the Ohio River and a short segment of the Licking River. This new designation places the Port of Cincinnati and Northern Kentucky 13th nationally in tonnage through the aggregation of more than 70 port and dock facilities. The nearly 50 million tons moved at the port means they now rank nationally between two deep-water coastal ports: the Port of Plaquemines in Louisiana at the mouth of the Mississippi River and Norfolk Harbor in Virginia. The Central Ohio River Business Association (CORBA) led the effort for re-designation expecting to be the busiest inland port in the nation and about 15th overall. The marketing strategy has already led to a memorandum of understanding between The Port of Cincinnati and Northern Kentucky and the Port of New Orleans to develop new business and cooperation. The 2-year collaborative agreement includes joint marketing activities, data interchange, regional market studies, and cross-training opportunities.
The Ports of Southern Lake Michigan?
So what can we learn from these efforts in Ohio and Kentucky? Is this approach to collaboration, port awareness, and advocacy applicable to similar geographic and economic scenarios? It certainly seems worth examining given the high levels of collaboration between the MAASTO states on the Great Lakes, the Mississippi, Illinois and Missouri Rivers. Additionally, it is typical for many of these ports to have concerns about decreasing federal investment and maintenance based on lower rankings in port tonnages. This aggregative approach could provide leverage to secure funding.
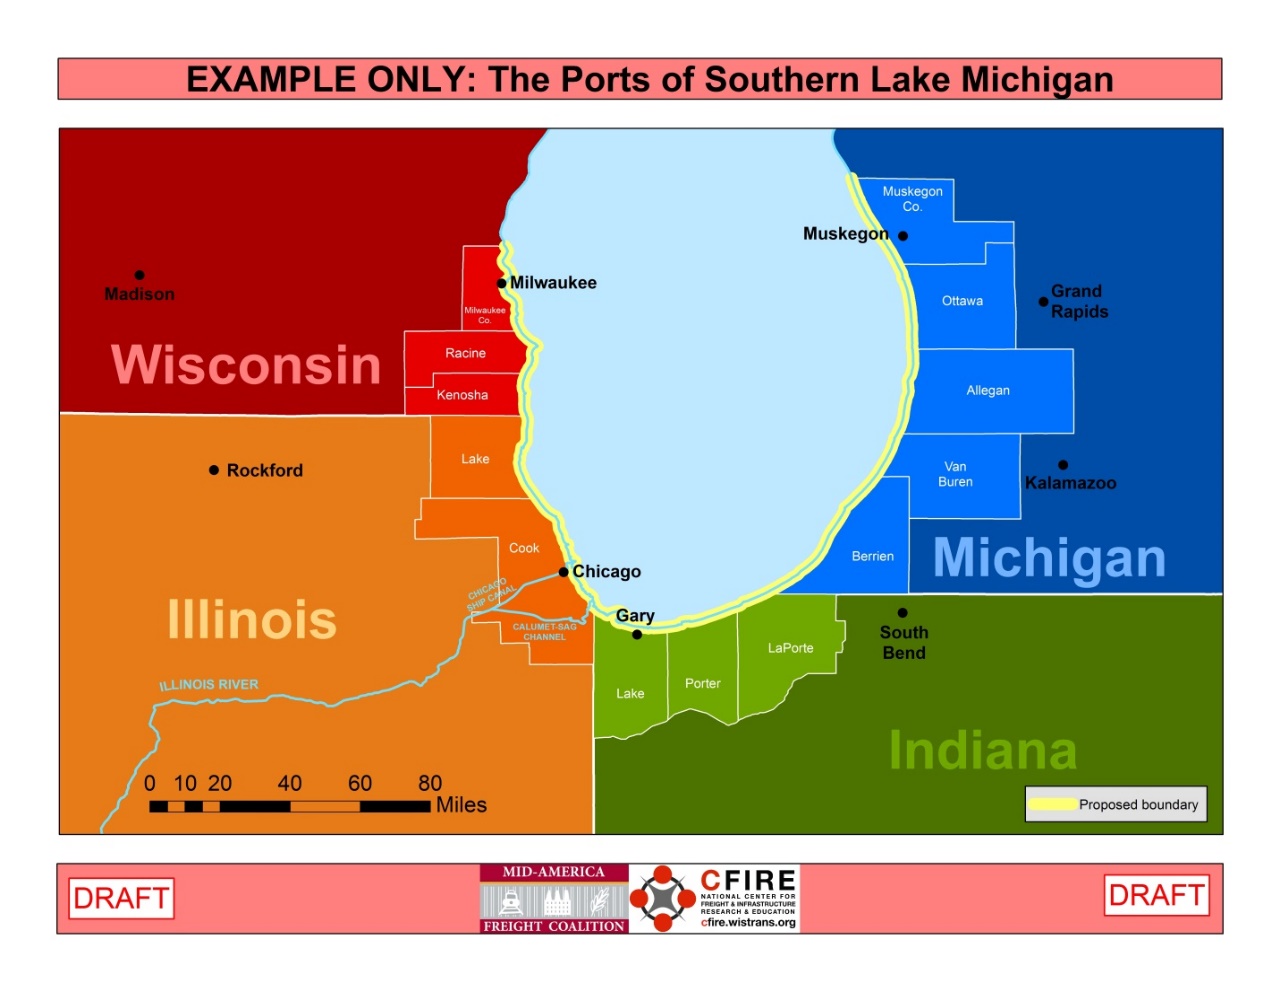
Consider for example a designation on Lake Michigan as the Port of Southern Lake Michigan. As shown in the map below, the ports along a 250 mile stretch of the southern shore of Lake Michigan include the Greater Chicago Metropolitan Area and important transportation hubs in Southeast Wisconsin, Northwestern Indiana, and Western Michigan. This region is comparable to the Ports of Cincinnati and Northern Kentucky in both tonnage, (with over 57 million tons in 2014) and geographical expanse. Commercial port facilities are generally clustered in the cities of Milwaukee, Chicago, Gary, and Muskegon. The region serves as a water gateway for the agricultural and manufacturing economies of the Midwest. The Great Lakes and St. Lawrence Seaway connects the region to Canadian, Northern European, and other Atlantic Ocean markets while the Mississippi River connects the region to Central, South American and Asian markets via the Panama Canal. The re-designation of the ports in this region has the potential to yield cooperative agreements that could boost short-sea and river barge shipping opportunities in the immediate area and increase collaboration with major ports like Montreal, New Orleans, or Houston. It would also elevate the awareness and eligibility of the port for greater investment given the significance of this system to the region.
From our visit to the Ports of Cincinnati and Northern Kentucky last fall, and with continued conversations with Kentucky and Ohio coalition members, the port designation appears to be a solid approach to generating freight and economic activity for this region. The effort has resulted in greater awareness, collaboration, and port status with the recent port tonnage reports. Programmatically speaking, the aggregation of the tonnage from these 70-plus terminals ensures this port qualifies for tonnage-based maintenance and program dollars. Further the elevated economic significance of this new port aligns well with TIGER and similar programs that focus on improvements of regional and national significance. This is one of many development strategies our region should be evaluating.
| Port Tonnage – Commercial Ports of Southern Lake Michigan (Thousand Tons of Cargo) |
||||
| Port | 2014 | 2013 | 2012 | 3-year Average |
| Port of Chicago, IL | 17,481 | 15,429 | 17,093 | 16,668 |
| Indiana Harbor, IN | 13,019 | 12,354 | 13,162 | 12,845 |
| Burns Waterway Harbor, IN | 9,604 | 8,669 | 8,878 | 9,050 |
| Gary Harbor, IN | 9,314 | 7,966 | 8,384 | 8,555 |
| Milwaukee Harbor, WI | 2,977 | 3,129 | 2,268 | 2,791 |
| Muskegon Harbor, MI | 1,849 | 1,479 | 1,691 | 1,673 |
| Buffington Harbor, IN | 1,589 | 1,338 | 1,497 | 1,475 |
| Grand Haven Harbor, MI | 721 | 752 | 711 | 728 |
| St. Joseph Harbor, MI | 243 | 256 | 272 | 257 |
| Holland Harbor, MI | 210 | 207 | 252 | 223 |
| Waukegan Harbor, IL | 26 | 78 | 91 | 65 |
| Total | 57,033 | 51,657 | 54,299 | 54,330 |
| *Obtained from USACE Waterborne Commerce of the United States Manuscript Cargo File | ||||
| http://www.navigationdatacenter.us/data/datawcus.htm | ||||